Quick Start
See the RetailHero tutorial notebook (EN ![]() , RU
, RU ![]() ) for details.
) for details.
Train and predict your uplift model
Use the intuitive python API to train uplift models with sklift.models.
 1# import approaches
 2from sklift.models import SoloModel, ClassTransformation
 3# import any estimator adheres to scikit-learn conventions.
 4from lightgbm import LGBMClassifier
 5
 6# define models
 7estimator = LGBMClassifier(n_estimators=10)
 8
 9# define metamodel
10slearner = SoloModel(estimator=estimator)
11
12# fit model
13slearner.fit(
14    X=X_tr,
15    y=y_tr,
16    treatment=trmnt_tr,
17)
18
19# predict uplift
20uplift_slearner = slearner.predict(X_val)
Evaluate your uplift model
Uplift model evaluation metrics are available in sklift.metrics.
 1# import metrics to evaluate your model
 2from sklift.metrics import (
 3    uplift_at_k, uplift_auc_score, qini_auc_score, weighted_average_uplift
 4)
 5
 6
 7# Uplift@30%
 8uplift_at_k = uplift_at_k(y_true=y_val, uplift=uplift_slearner,
 9                          treatment=trmnt_val,
10                          strategy='overall', k=0.3)
11
12# Area Under Qini Curve
13qini_coef = qini_auc_score(y_true=y_val, uplift=uplift_slearner,
14                           treatment=trmnt_val)
15
16# Area Under Uplift Curve
17uplift_auc = uplift_auc_score(y_true=y_val, uplift=uplift_slearner,
18                              treatment=trmnt_val)
19
20# Weighted average uplift
21wau = weighted_average_uplift(y_true=y_val, uplift=uplift_slearner,
22                              treatment=trmnt_val)
Vizualize the results
Visualize performance metrics with sklift.viz.
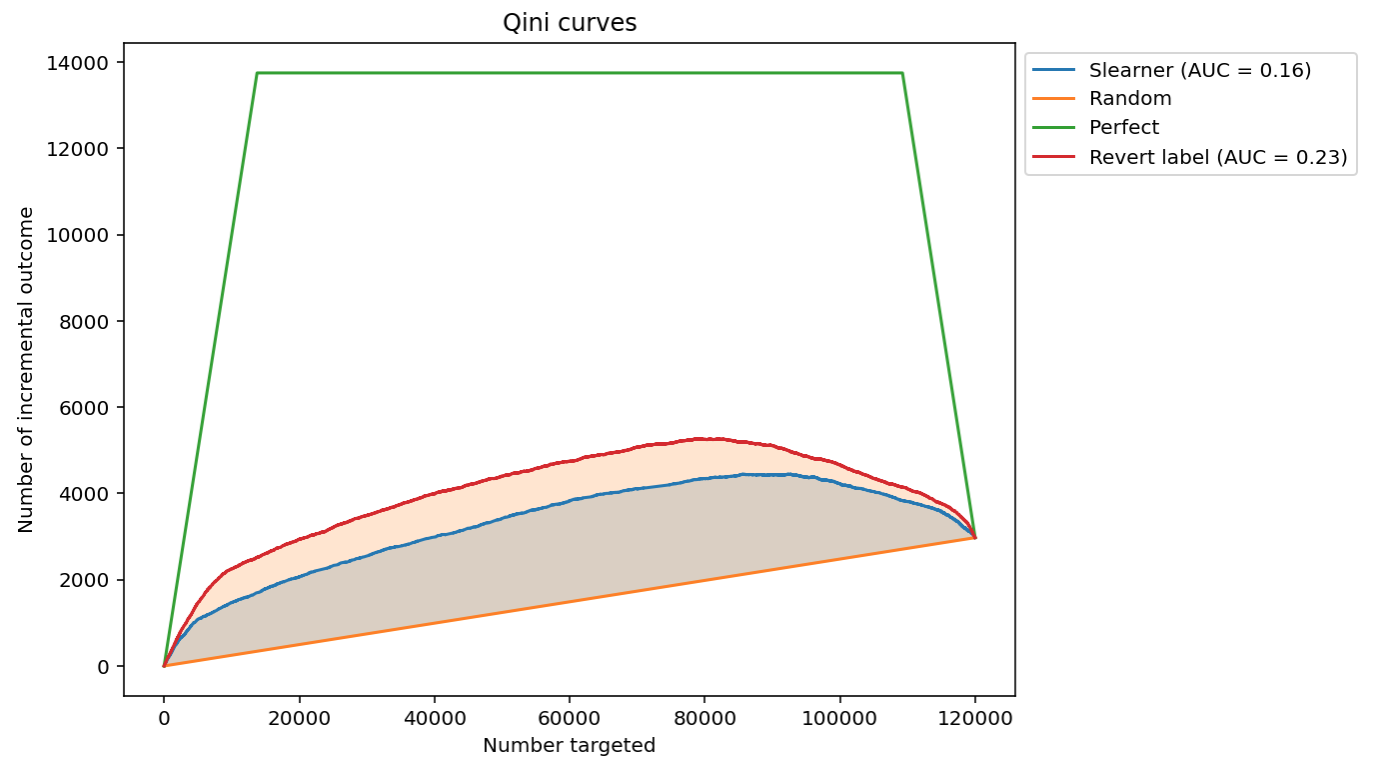
 1from sklift.viz import plot_qini_curve
 2import matplotlib.pyplot as plt
 3
 4fig, ax = plt.subplots(1, 1)
 5ax.set_title('Qini curves')
 6
 7plot_qini_curve(
 8    y_test, uplift_slearner, trmnt_test,
 9    perfect=True, name='Slearner', ax=ax
10);
11
12plot_qini_curve(
13    y_test, uplift_revert, trmnt_test,
14    perfect=False, name='Revert label', ax=ax
15);
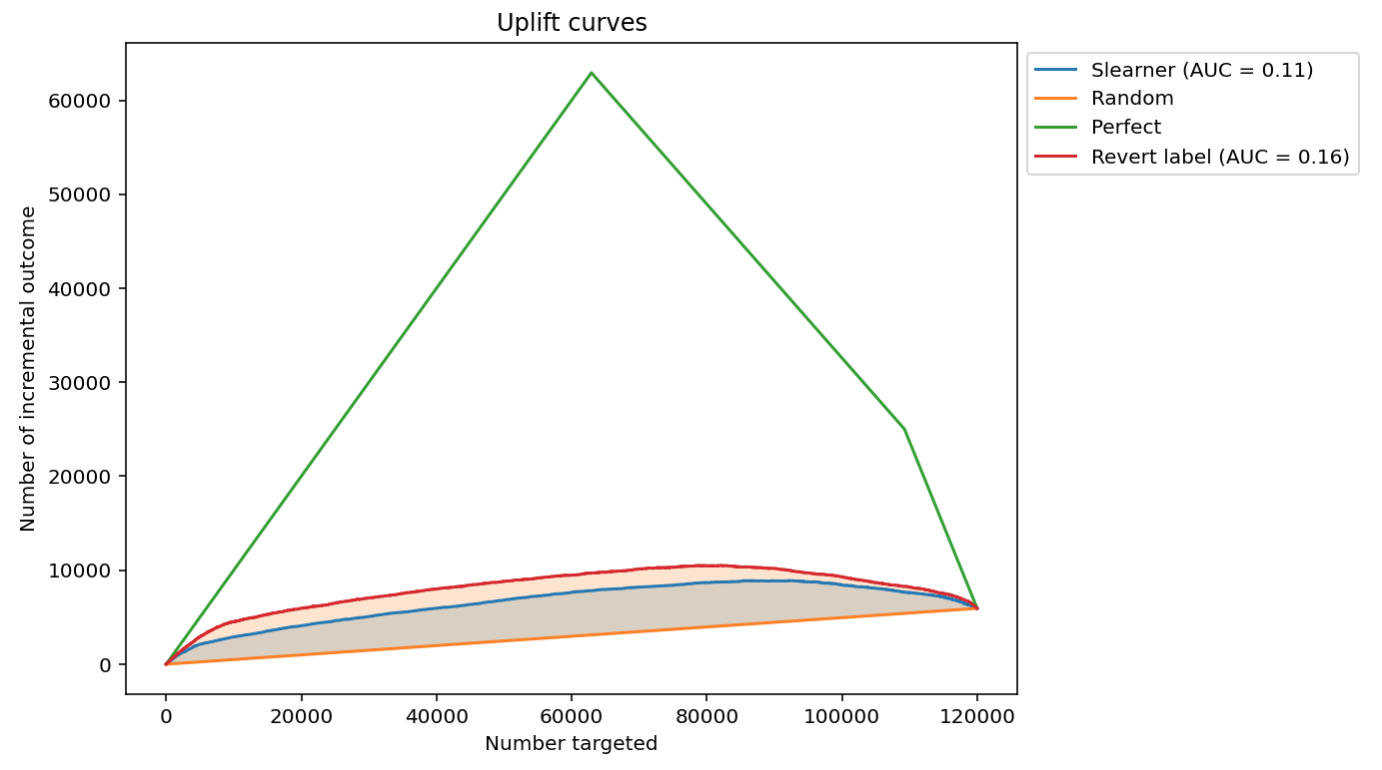
 1from sklift.viz import plot_uplift_curve
 2import matplotlib.pyplot as plt
 3
 4fig, ax = plt.subplots(1, 1)
 5ax.set_title('Uplift curves')
 6
 7plot_uplift_curve(
 8    y_test, uplift_slearner, trmnt_test,
 9    perfect=True, name='Slearner', ax=ax
10);
11
12plot_uplift_curve(
13    y_test, uplift_revert, trmnt_test,
14    perfect=False, name='Revert label', ax=ax
15);
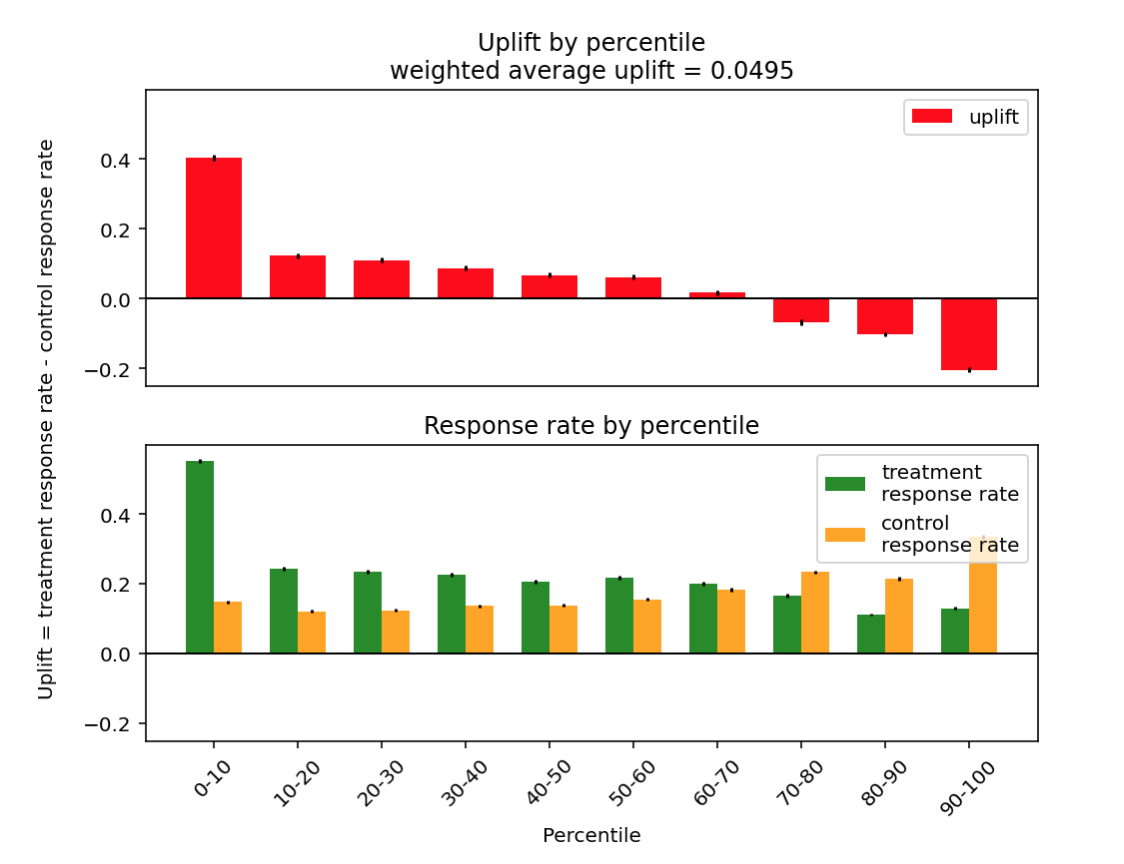
1from sklift.viz import plot_uplift_by_percentile
2
3plot_uplift_by_percentile(y_true=y_val, uplift=uplift_preds,
4                          treatment=treat_val, kind='bar')