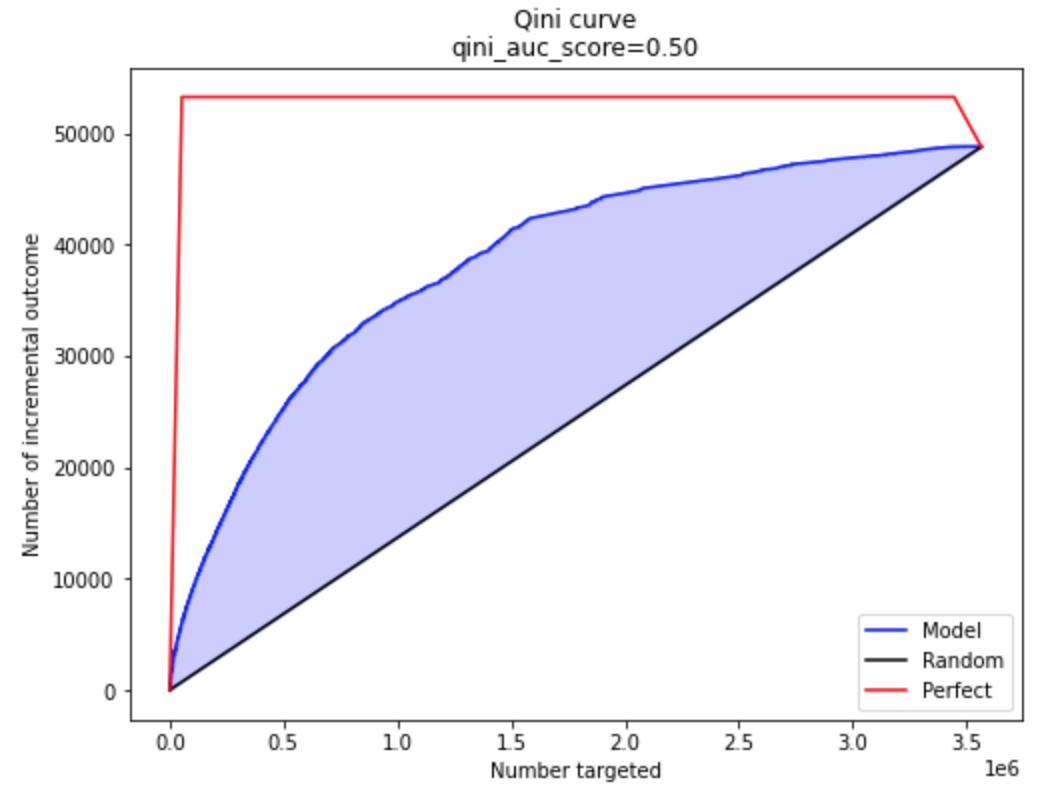
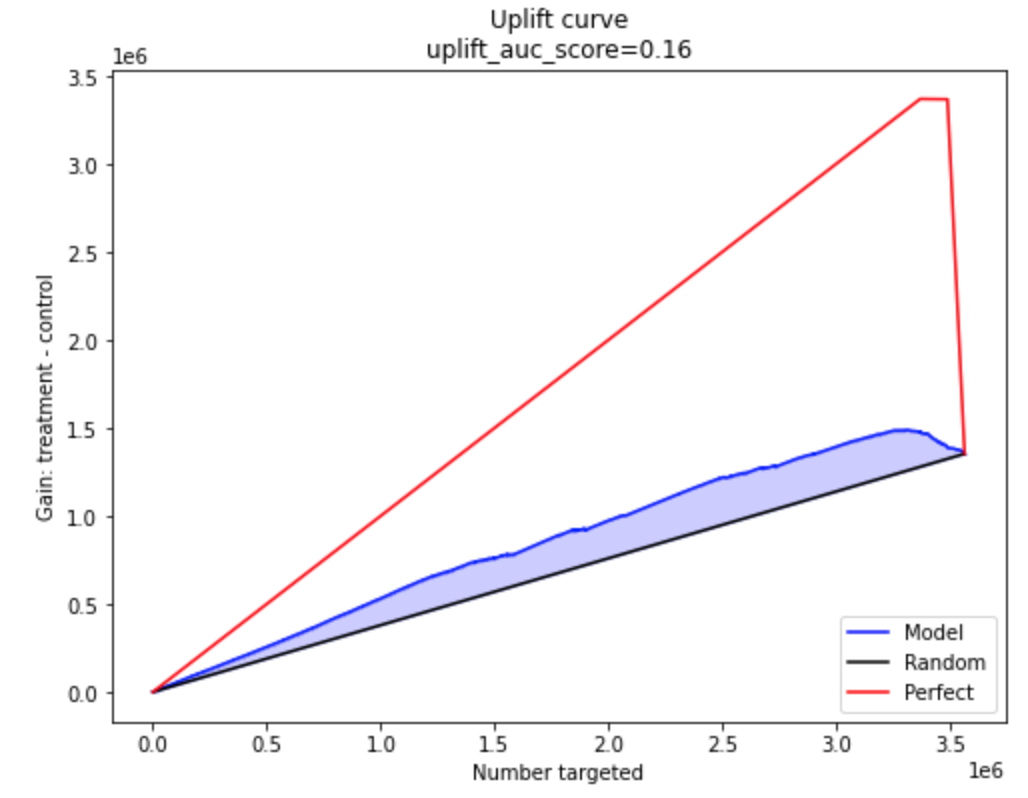
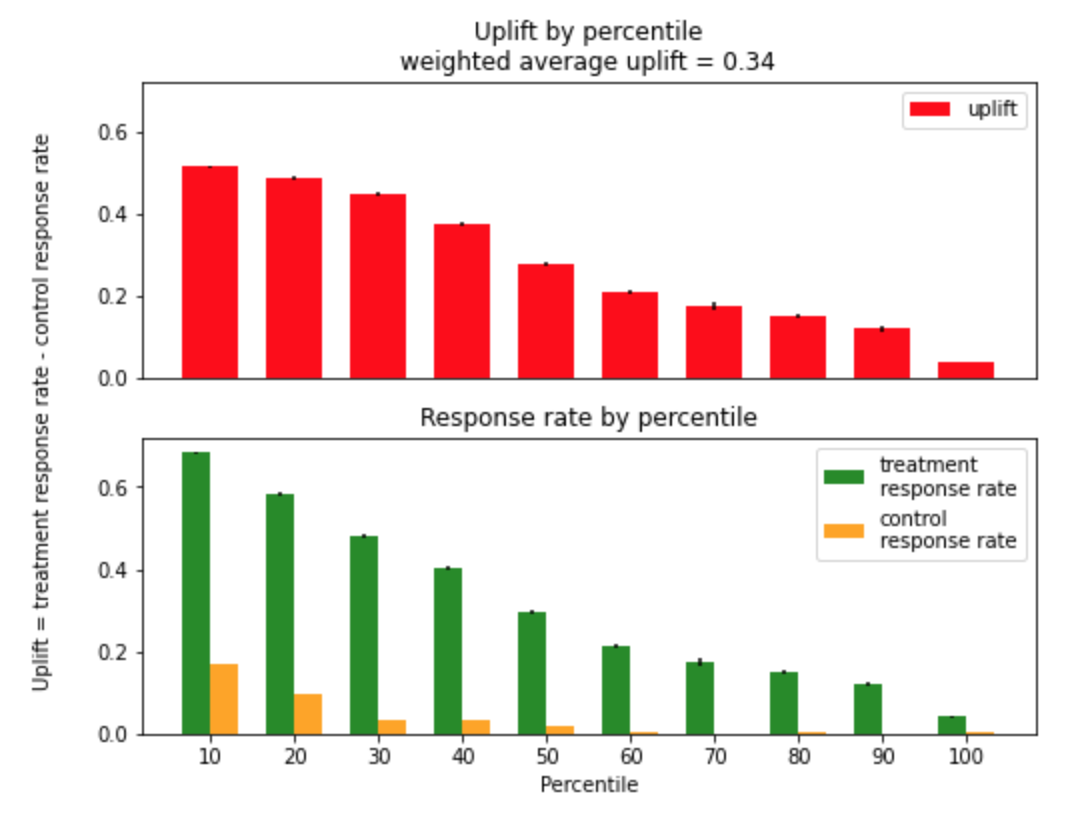
Quick Start

See the RetailHero tutorial notebook (EN Open In Colab1, RU Open In Colab2) for details.

Train and predict your uplift model

Use the intuitive python API to train uplift models.

 1
 2
 3
 4
 5
 6
 7
 8
 9
10
11
12
13
14
15
16
17
18
19
# import approaches
from sklift.models import SoloModel, ClassTransformation, TwoModels
# import any estimator adheres to scikit-learn conventions.
from catboost import CatBoostClassifier


# define models
treatment_model = CatBoostClassifier(iterations=50, thread_count=3,
                                     random_state=42, silent=True)
control_model = CatBoostClassifier(iterations=50, thread_count=3,
                                   random_state=42, silent=True)

# define approach
tm = TwoModels(treatment_model, control_model, method='vanilla')
# fit model
tm = tm.fit(X_train, y_train, treat_train)

# predict uplift
uplift_preds = tm.predict(X_val)

Evaluate your uplift model

 1
 2
 3
 4
 5
 6
 7
 8
 9
10
11
12
13
14
15
16
17
18
19
20
21
22
# import metrics to evaluate your model
from sklift.metrics import (
    uplift_at_k, uplift_auc_score, qini_auc_score, weighted_average_uplift
)


# Uplift@30%
tm_uplift_at_k = uplift_at_k(y_true=y_val, uplift=uplift_preds,
                             treatment=treat_val,
                             strategy='overall', k=0.3)

# Area Under Qini Curve
tm_qini_auc = qini_auc_score(y_true=y_val, uplift=uplift_preds,
                             treatment=treat_val)

# Area Under Uplift Curve
tm_uplift_auc = uplift_auc_score(y_true=y_val, uplift=uplift_preds,
                                 treatment=treat_val)

# Weighted average uplift
tm_wau = weighted_average_uplift(y_true=y_val, uplift=uplift_preds,
                                 treatment=treat_val)

Vizualize the results

1
2
3
from sklift.viz import plot_qini_curve

plot_qini_curve(y_true=y_val, uplift=uplift_preds, treatment=treat_val, negative_effect=True)
Example of model's qini curve, perfect qini curve and random qini curve
1
2
3
from sklift.viz import plot_uplift_curve

plot_uplift_curve(y_true=y_val, uplift=uplift_preds, treatment=treat_val)
Example of model's uplift curve, perfect uplift curve and random uplift curve
1
2
3
4
from sklift.viz import plot_uplift_by_percentile

plot_uplift_by_percentile(y_true=y_val, uplift=uplift_preds,
                          treatment=treat_val, kind='bar')
Uplift by percentile